One of the more obvious criterion when checking image quality is resolution. Scanning resolution is usually given in dpi or ppi (dots or pixels per inch) but this is not enough to check the sharpness of the image.
Image quality standards like ISO19264, Metamorfoze or FADGI are talking about sampling efficiency, so what is sampling efficiency?
Resolution includes sampling frequency and sampling efficiency:
- Sampling frequency is the number of pixels per spatial unit, well known as dpi (dots per inch).
- Sampling efficiency is the result of this sampling which can be good or not, making the difference between a sharp and a blurred image.
We can estimate the sharpness of an image by scanning a chart like the one shown below. It has vertical and horizontal black and white lines and the number tells how many pairs of lines (one black line plus one white line) there are in one millimeter:
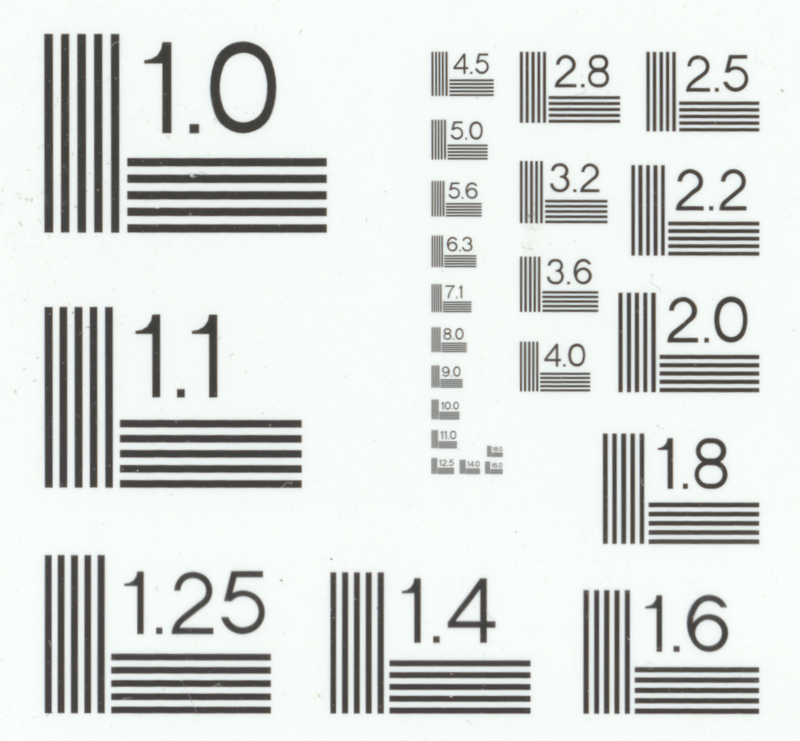
Here is an example of this chart scanned at 600dpi with two different scanners: The part of the chart is where there is 11 lines pairs by millimeter.
Image is enlarged and we can see that one line is about one pixel wide. Two pixels can be enough to scan a pair of line as long as one pixel is in front of the black line and the next one is in front of the white line.
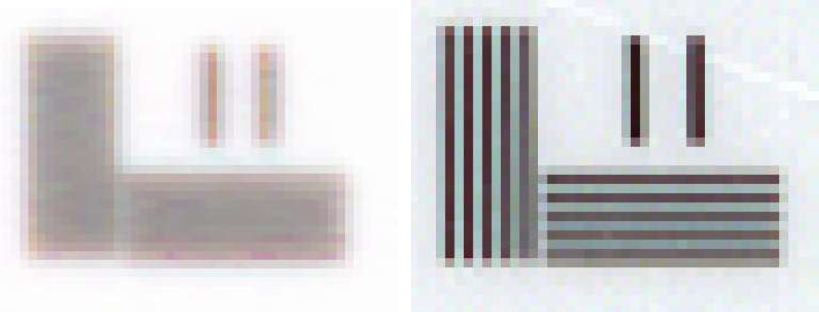
Both images have the same sampling frequency (same number of pixels per inch) but not the same sampling efficiency: we can clearly see the lines in the right-side image but not at all in the left-side image.
Scanning at 600dpi means getting 600 pixels per inch so 23.6 pixels per millimeter and then 11.8 pair of pixels per millimeter. As one pixel can give only one value, this part of the chart has then the highest frequency that can be scanned at 600dpi.
That means the right image get a good sampling efficiency and the left one not; but we don’t get any number to evaluate that.
How to measure sampling efficiency?
Sampling efficiency can be measured by scanning another chart like the one shown below:
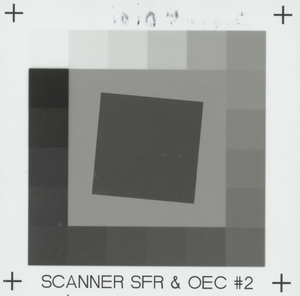
A piece of software can then analyze the slanted edges of the chart and give the frequency response (MTF)
Contrast is dropping when frequency is increasing, and we will check for which frequency contrast drops to 10%.
In the sample below, made at 300dpi, contrast is 10% for 5.37 pairs of lines per mm and as the maximum frequency for 300dpi is 5.9 lp/mm, the efficiency is 5.37/5.9 = 91%.
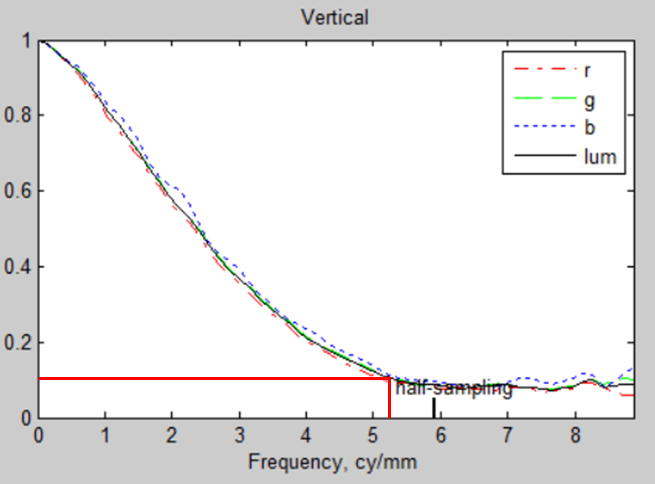
We now get a number qualifying the sharpness of the image and we can know if it is good or not by comparing to guidelines recommendations.
A good image has usually to reach 80 to 85% for sampling efficiency.